Navigation bridge
11.2 Kn
115°
Search
11:25:03
07/02/2022
2
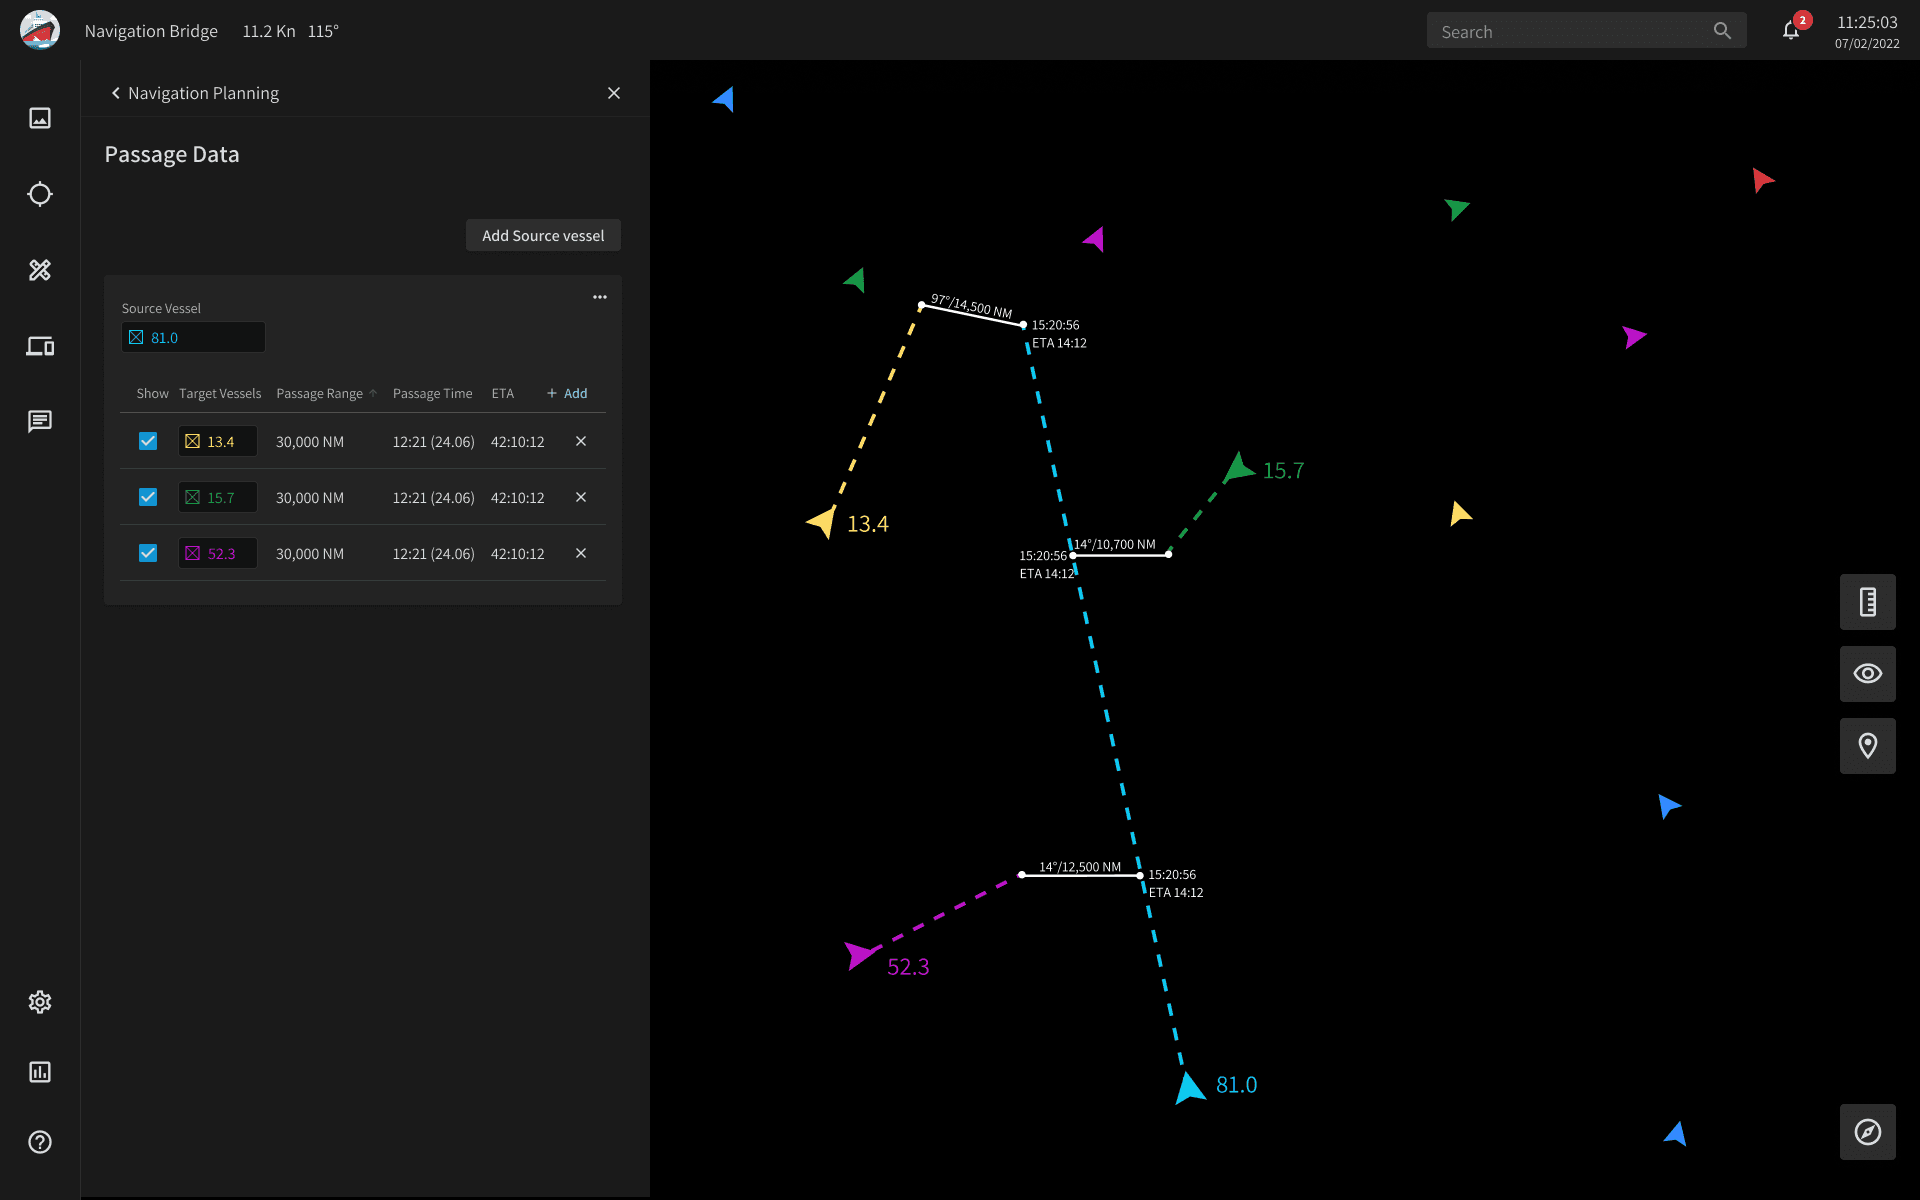
Navigation Planning
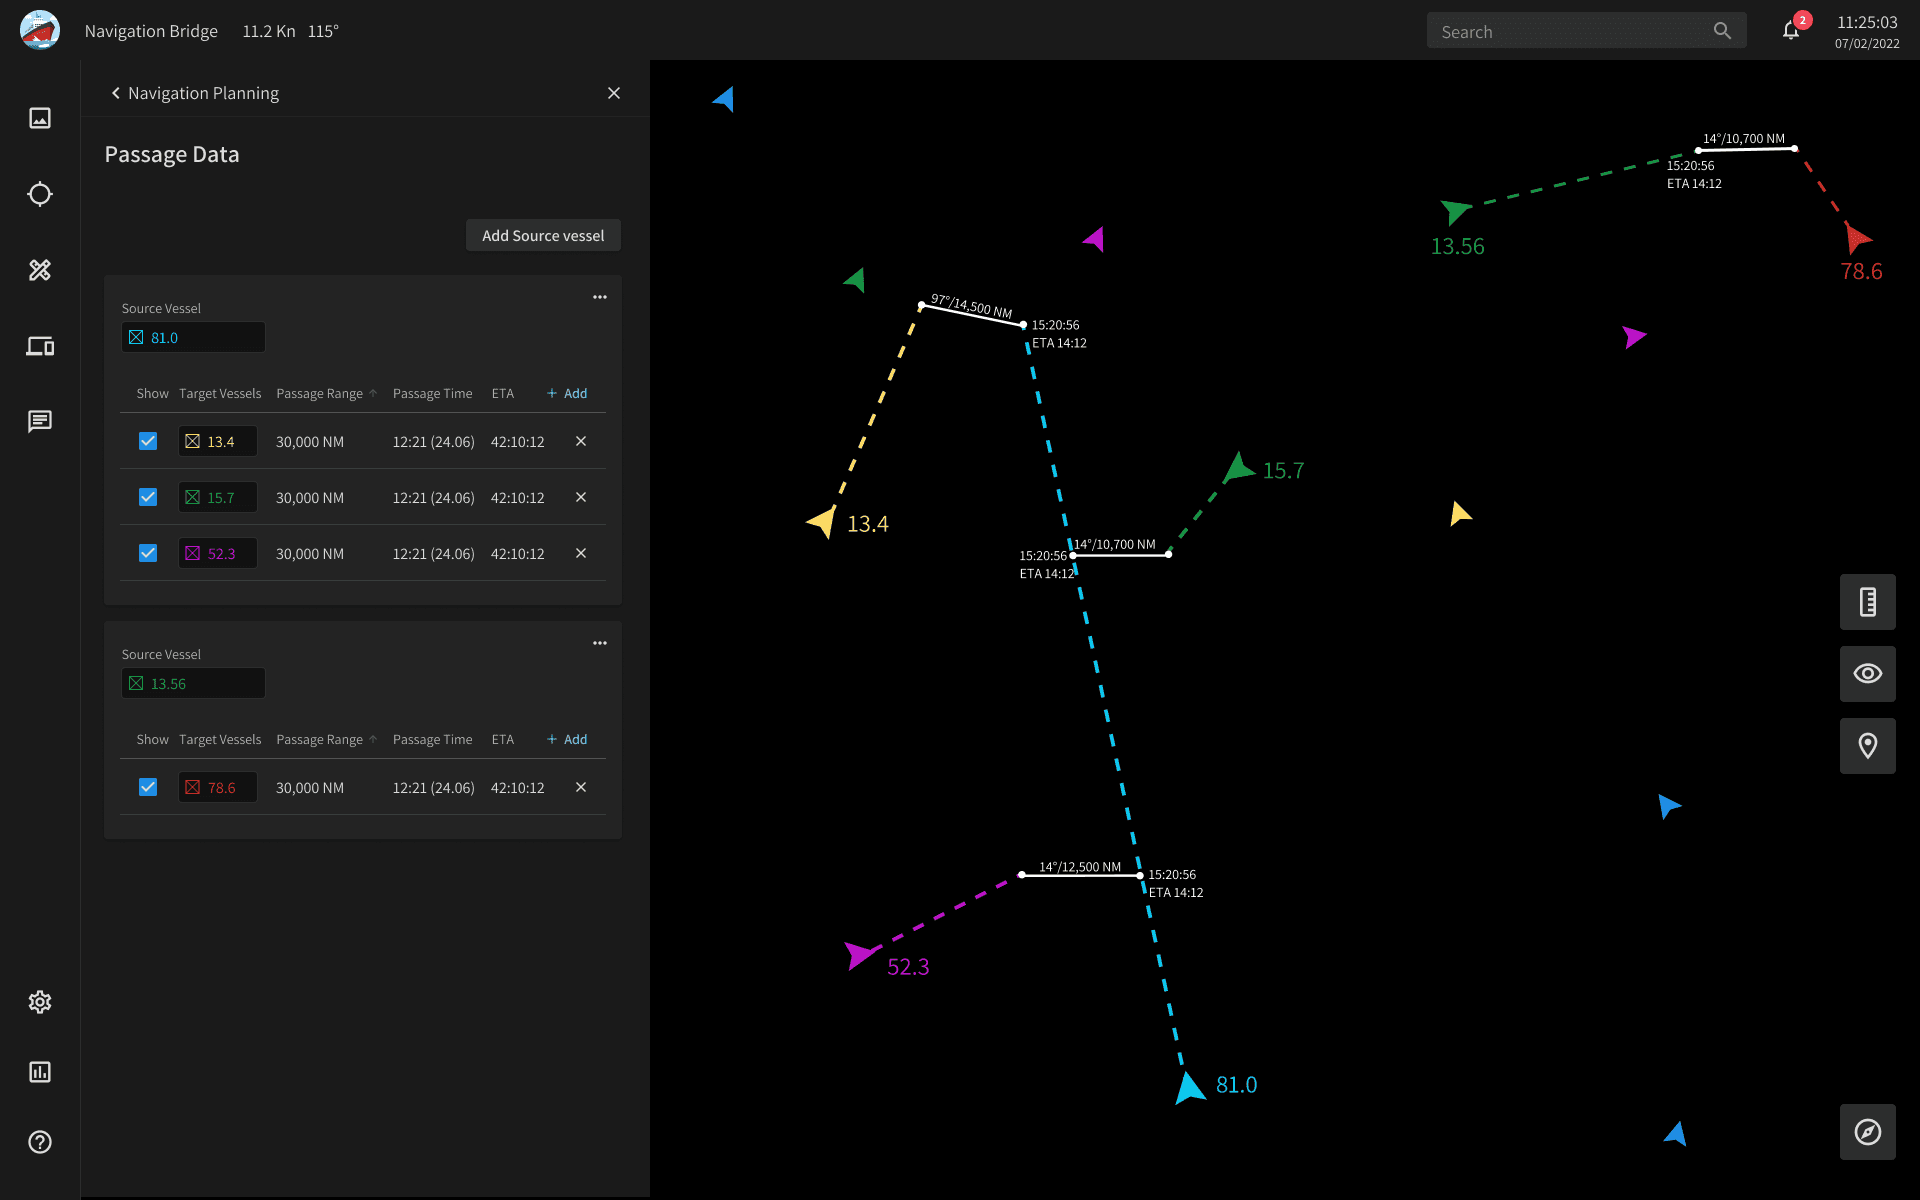
Passage Data
Add Source vessel
Source Vessel
81.0
Min Range: 5,000 NM
Show
Target Vessels
Passage Range
Passage Time
ETA
Add
13.4
30,000 NM
12:21 (24.06)
42:10:12
15.7
30,000 NM
12:21 (24.06)
42:10:12
52.3
30,000 NM
12:21 (24.06)
42:10:12
Source Vessel
13.56
Min Range: 5,000 NM
Show
Target Vessels
Passage Range
Passage Time
ETA
Add
78.6
30,000 NM
12:21 (24.06)
42:10:12
81.0
52.3
13.4
15.7
97°/14,500 NM
14°/10,700 NM
14°/12,500 NM
15:20:56
ETA 14:12
15:20:56
ETA 14:12
15:20:56
ETA 14:12
13.56
78.6
15:20:56
ETA 14:12
14°/10,700 NM
Navigation bridge
11.2 Kn
115°
Search
11:25:03
07/02/2022
2
Navigation Planning
Passage Data
Add Source vessel
Source Vessel
81.0
Min Range: 5,000 NM
Show
Target Vessels
Passage Range
Passage Time
ETA
Add
13.4
30,000 NM
12:21 (24.06)
42:10:12
15.7
30,000 NM
12:21 (24.06)
42:10:12
52.3
30,000 NM
12:21 (24.06)
42:10:12
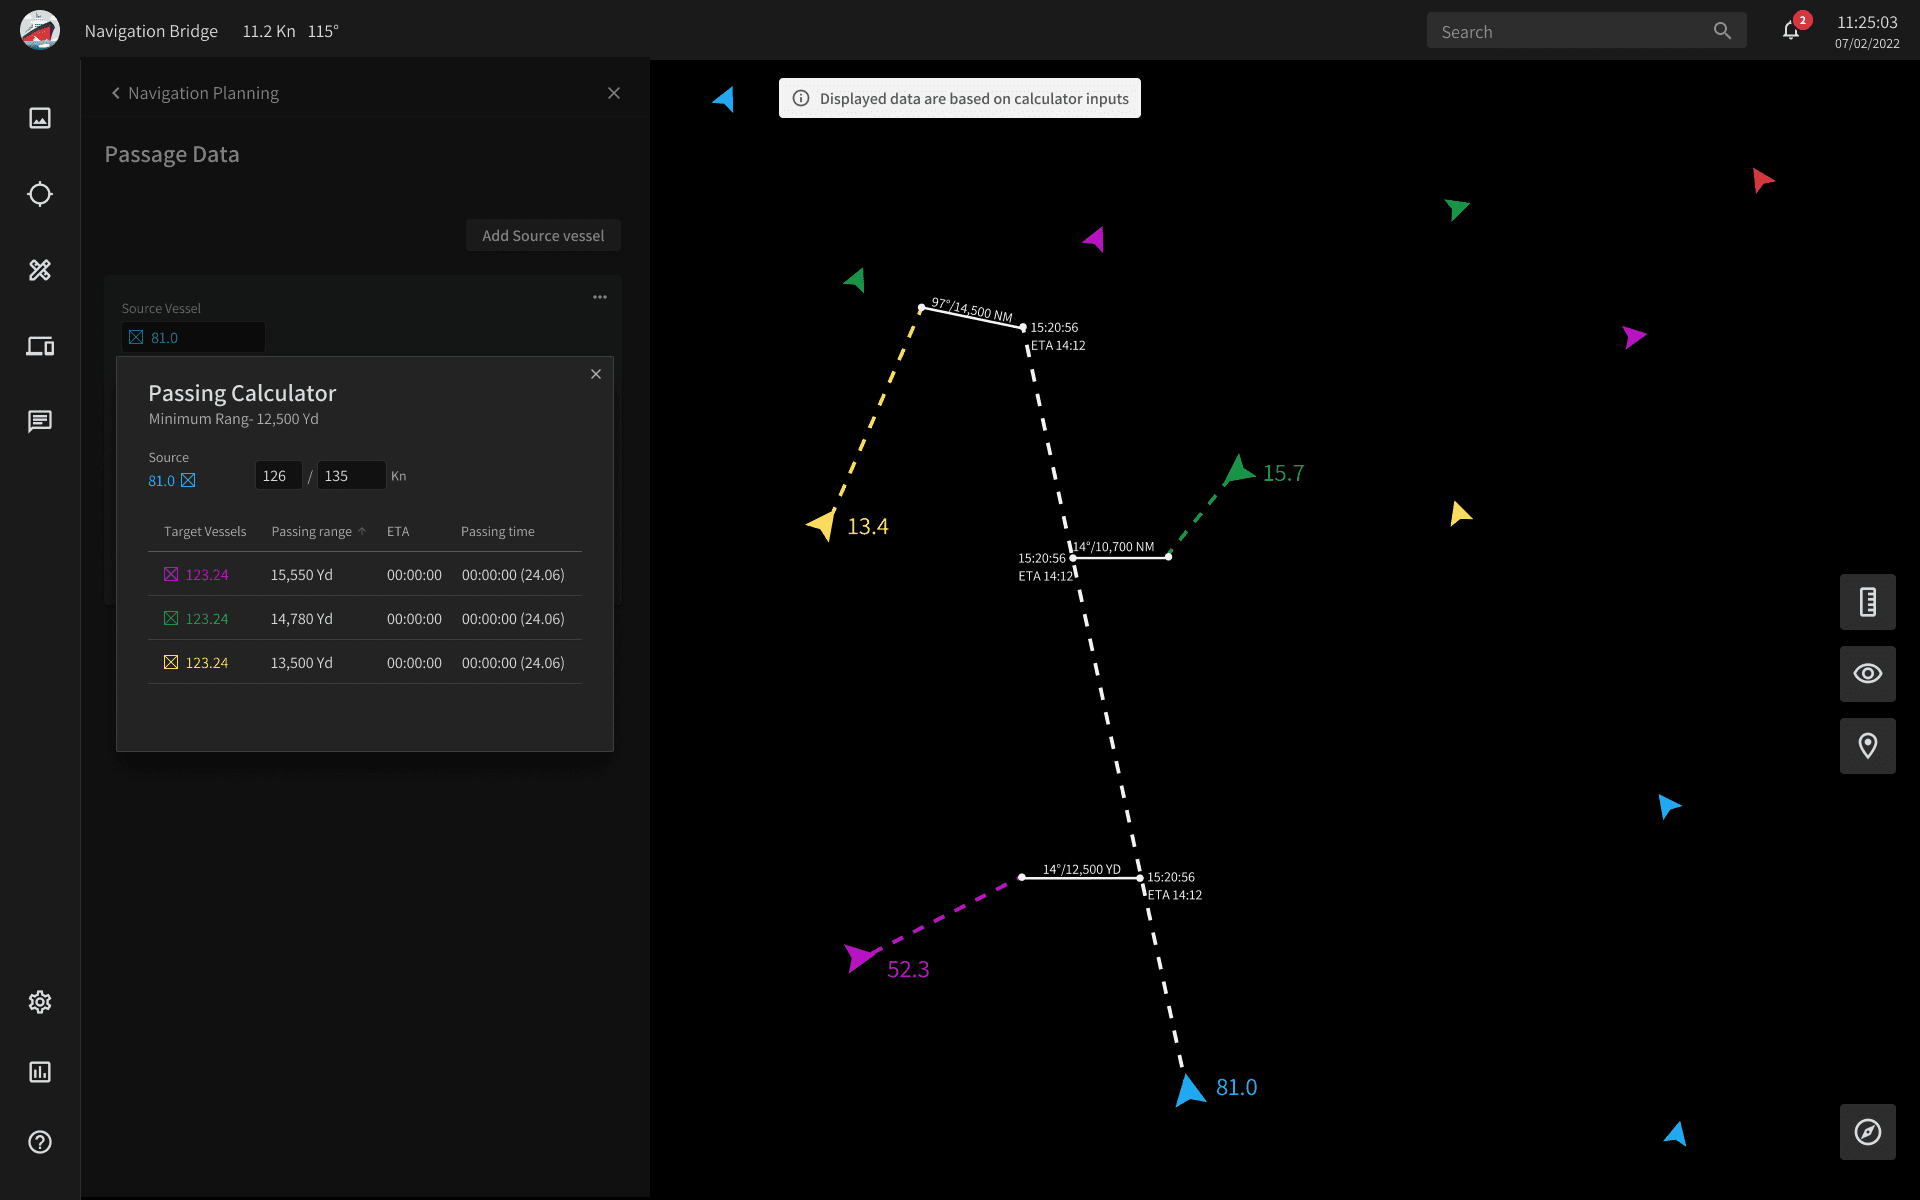
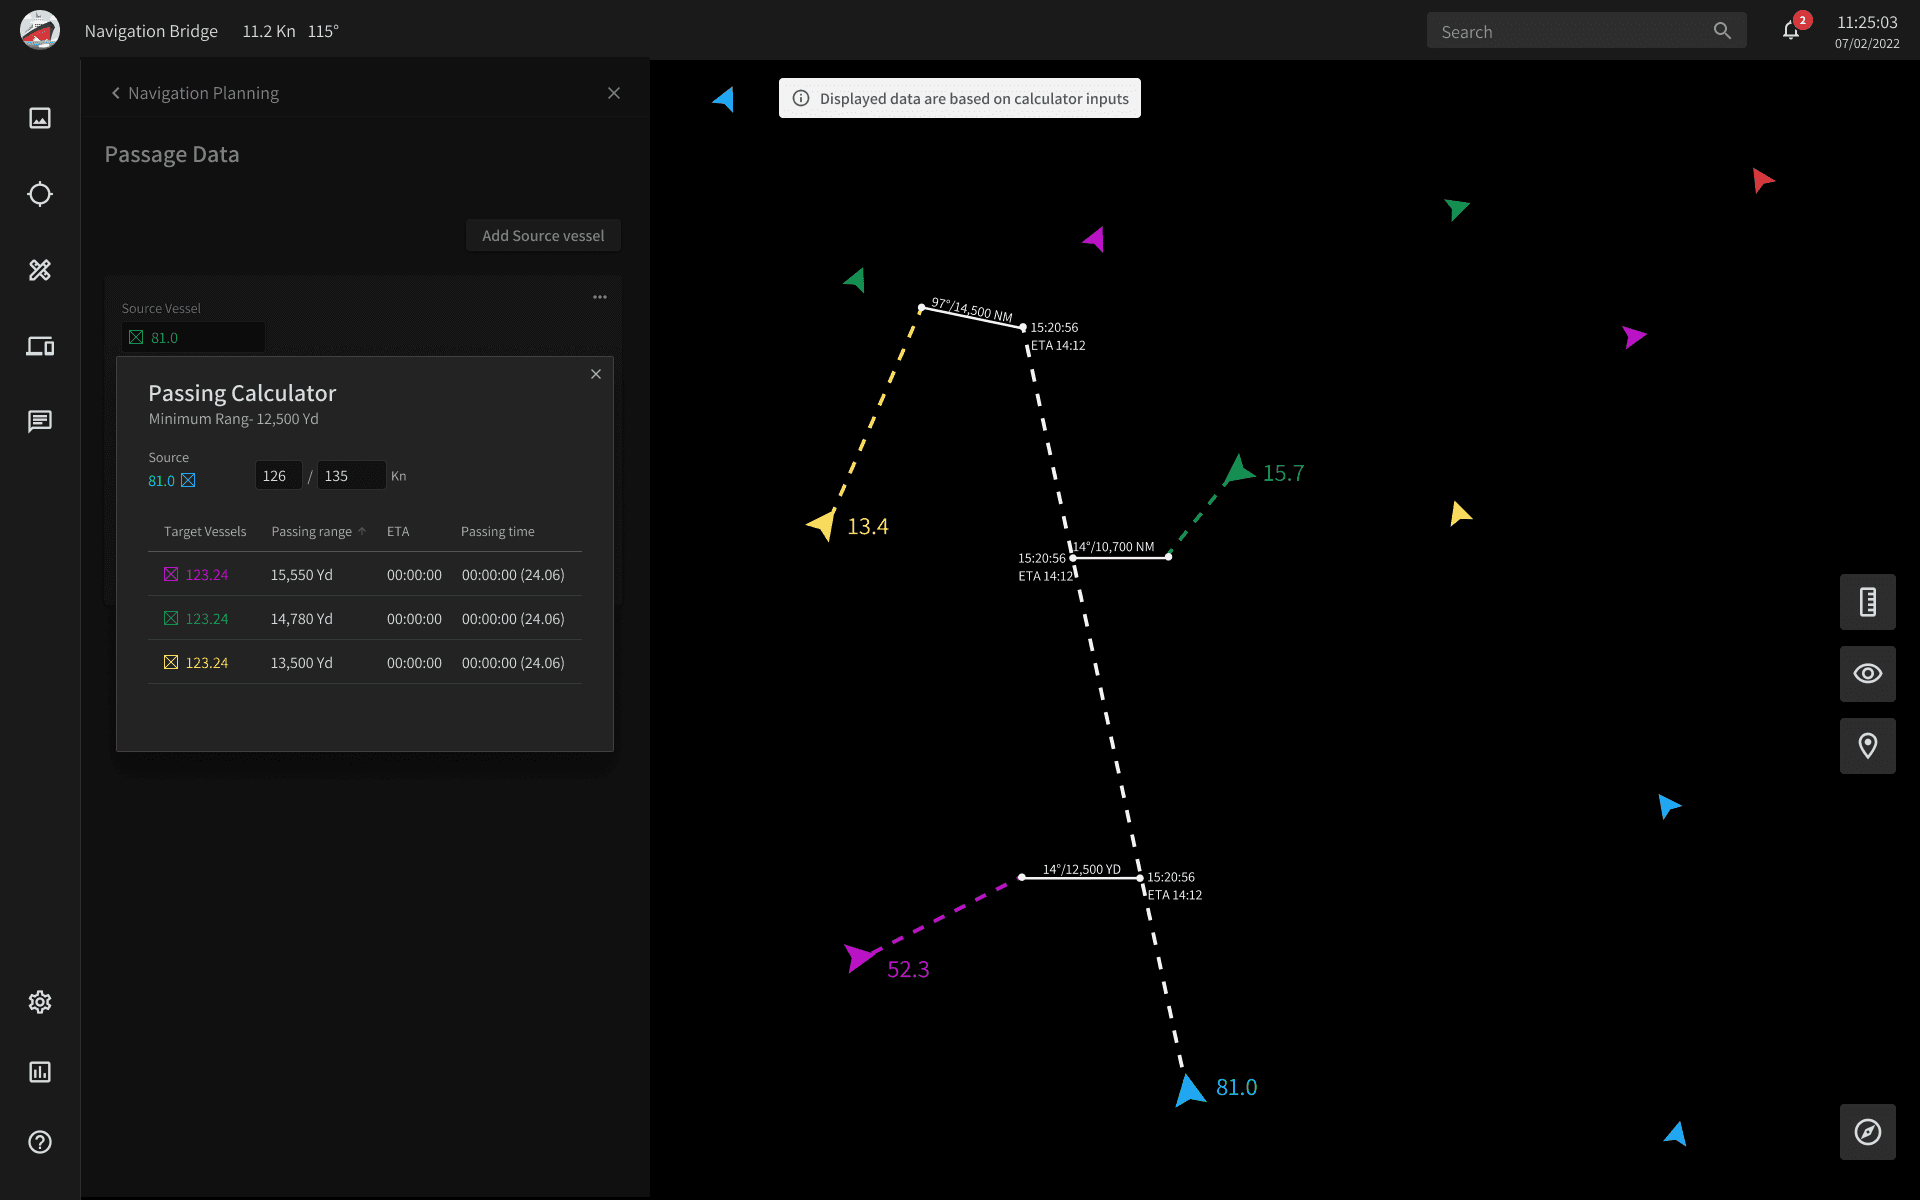
Passing Calculator
Minimum Rang- 12,500 Yd
Source
81.0
126
/
135
Kn
Target Vessels
Passing range
ETA
Passing time
123.24
15,550 Yd
00:00:00
00:00:00 (24.06)
123.24
14,780 Yd
00:00:00
00:00:00 (24.06)
123.24
13,500 Yd
00:00:00
00:00:00 (24.06)
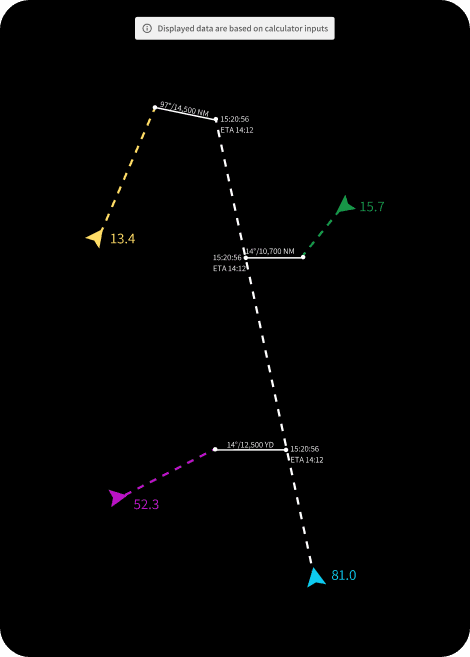
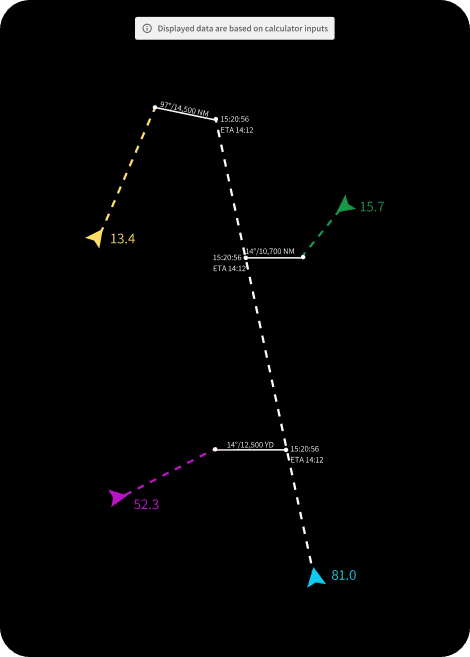
Displayed data are based on calculator inputs
81.0
52.3
13.4
15.7
97°/14,500 NM
14°/10,700 NM
14°/12,500 YD
15:20:56
ETA 14:12
15:20:56
ETA 14:12
15:20:56
ETA 14:12
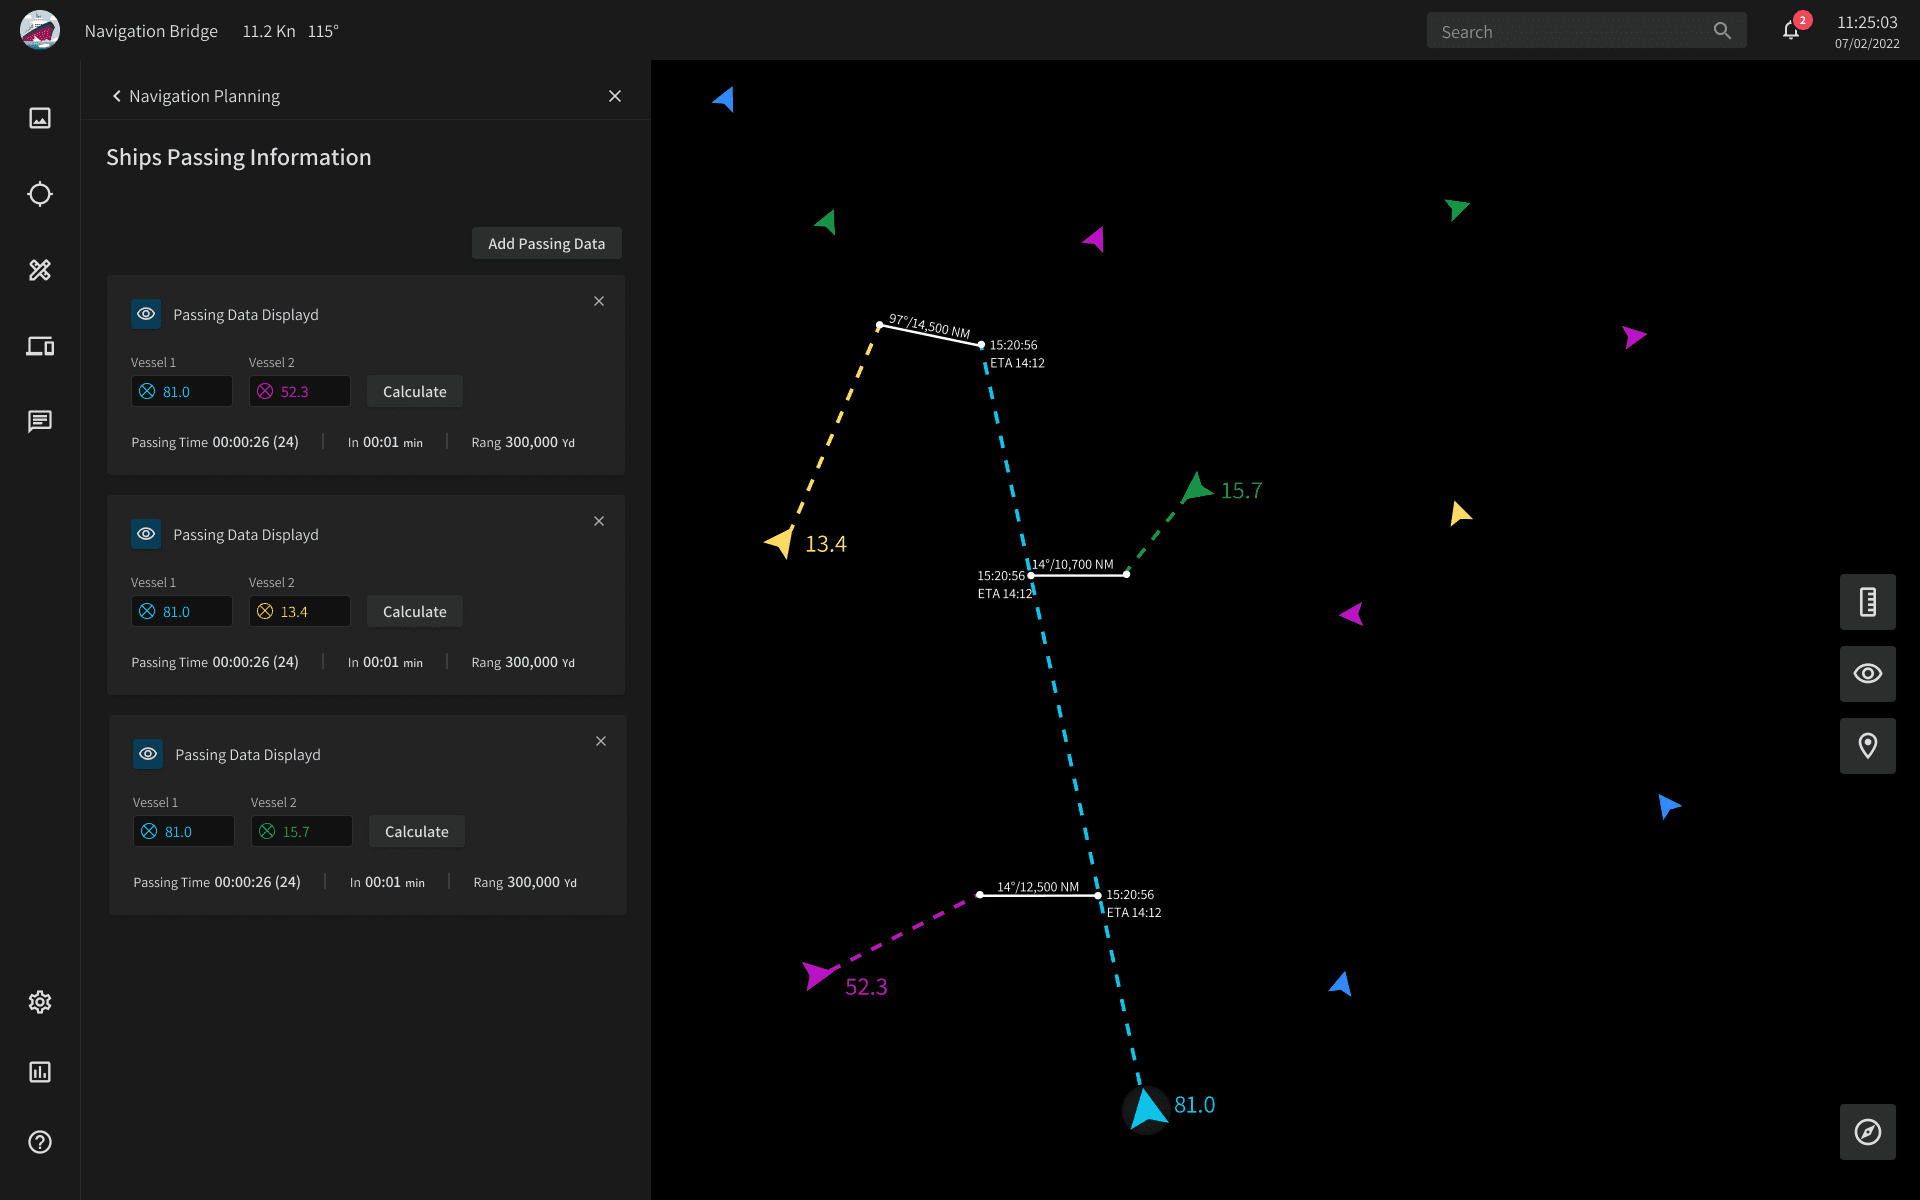
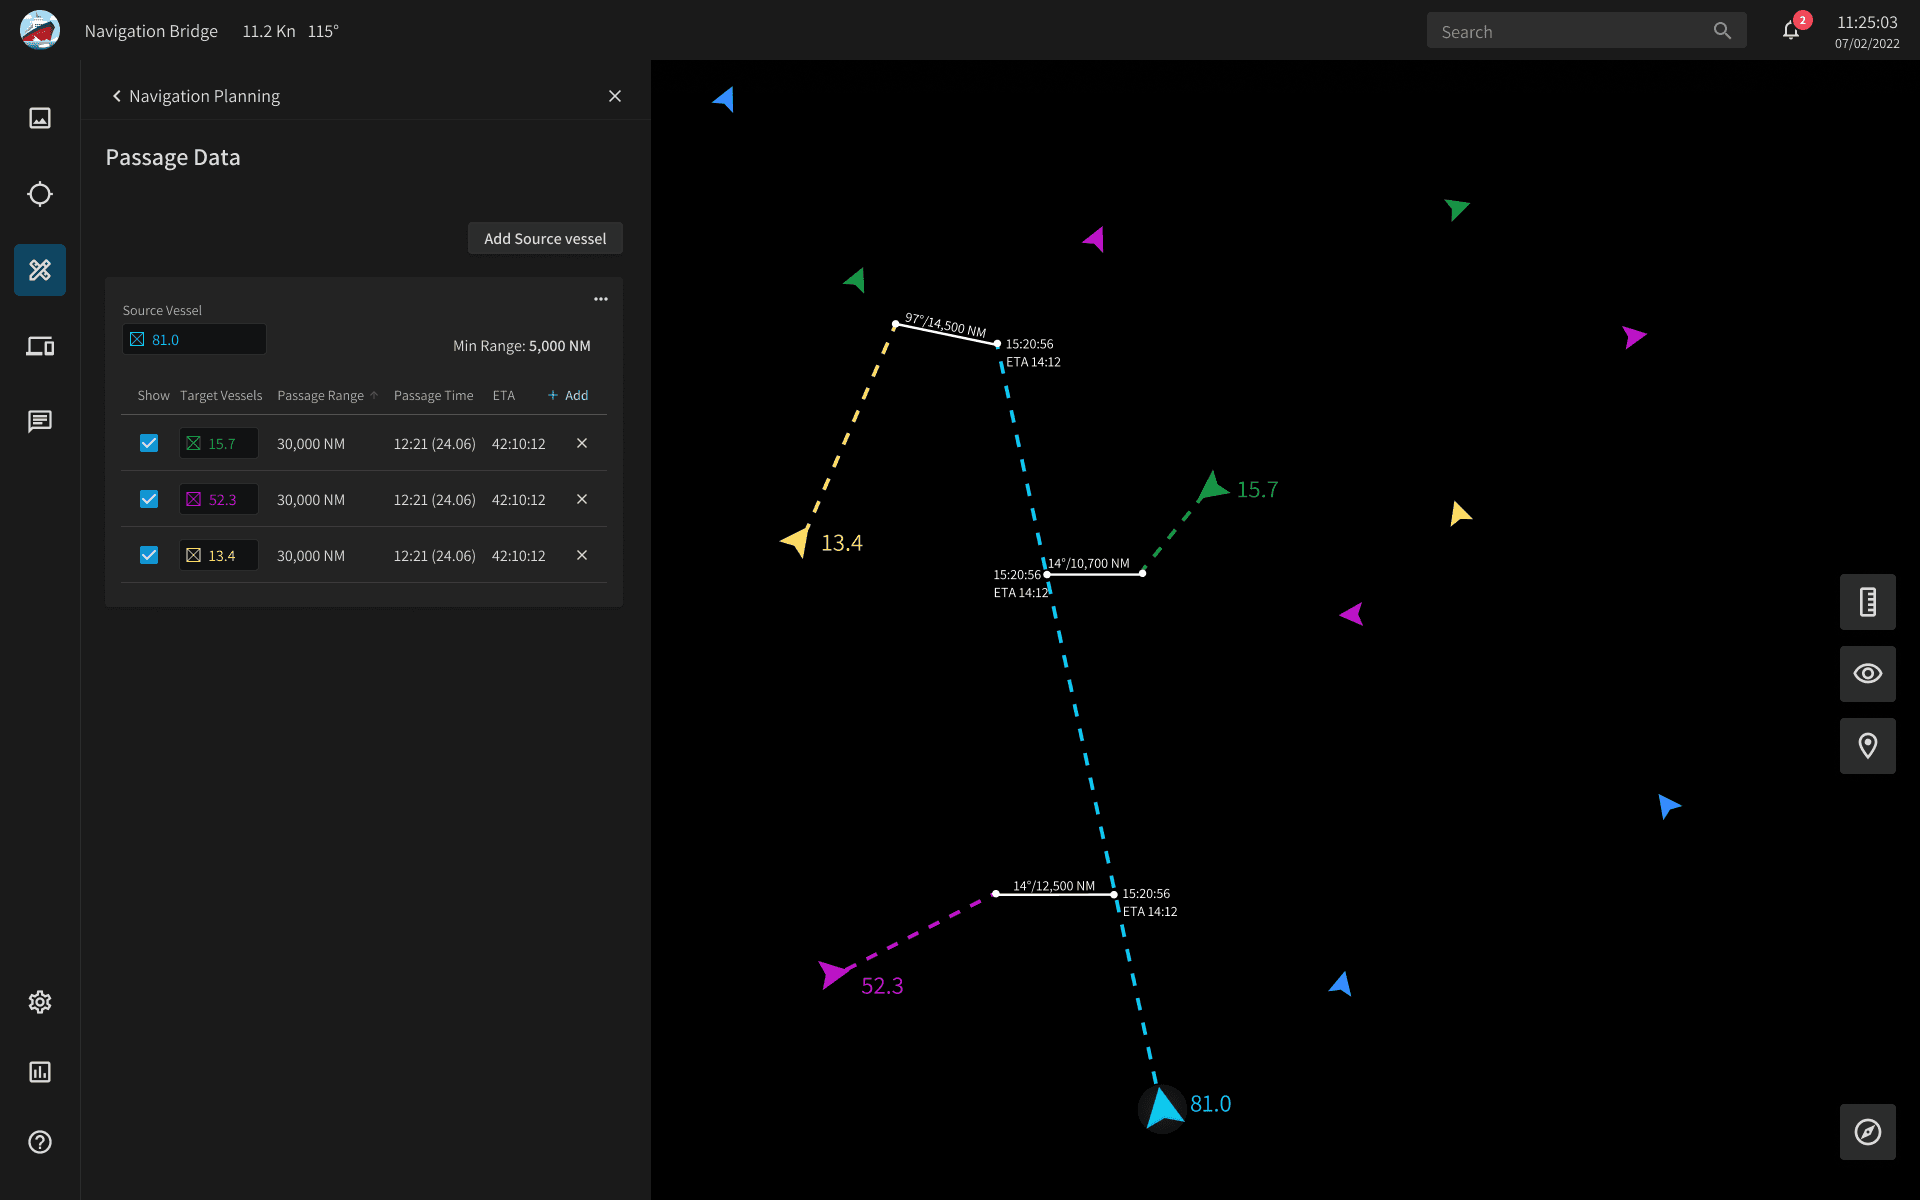
Ships Passing Data
“Zoharim” feature
Manage Multiple Vessels
The user research highlighted the need to manage data for multiple vessels.
What started as a task for a calculator feature expanded into creating a comparative table to handle information overload effectively.
Before
Users had to create new cards for each vessel to calculate distances.
There was no clear indication if the transition data was safe for navigation.

After
A table was added to compare vessel transition ranges, with sorting options by distance and time.
A minimum range feature was added, including notifications when the range is reached.
Passage Data calculator
I improved real-time vessel adjustments by designing a more accessible and user-friendly calculator. The old tool lacked live data integration and was hard to use. My solution seamlessly integrates into the system, allowing for dynamic updates and better decision-making during operations.
Live map updates show how vessels will pass each other based on simulated data.
Helps operators evaluate and adjust navigation for safer operations.
Compares multiple vessels in one view for better situational understanding.
Allows fast data adjustments using +/- keys, enabling quick jumps between values without manual input each time.
Usability Testing
I conducted usability tests with the users and introduced them to a prototype. During the real-time simulation with the calculator, I noticed that they struggled and were confused about what the data on the map represented.
As a result, I changed the source vessel's course color to white (to clarify that the speed is not real) and added a snackbar on the map explaining that the current data is simulated.
Before
There was no clear indication if the data was real-time or a simulated calculation.
After
A different color and a snackbar now indicate that the data is simulated.
Users research
To better understand the problem, I interviewed officers and control operators to learn how they use the system.
Some of the key questions I asked:
What is the purpose of the passage data form for you?
To ensure the safety of navigation and to be aware that I am not getting close to other vessels.
At what stage of the sailing do you use passage data?
Most of the time, especially when we enter ports and there are many vessels.
How many vessels are we talking about?
It depends, most of the time, I need to calculate passage data for 3 to 5 vessels simultaneously.
What is the purpose of the passage data form for you?
To ensure the safety of navigation and to be aware that I am not getting close to other vessels.
What is the purpose of the passage data form for you?
The minimum distance varies depending on instructions from the commander.
Insights
Navigation Safety: Users rely on transition data to prevent collisions, emphasizing the need for accurate, real-time information.
Manage Multiple Vessels:Users mange data for 3-5 vessels, requiring a user-friendly interface that can manage multiple data points simultaneously.
Warning Zone: When there are many vessels, it’s hard to monitor minimum distances. Users need a tool to set and receive alerts for minimum safe distances.
sailing Planning: Users plan sailing routes in advance and need a tool that integrates planning with real-time data to adjust speed and course.
Sea Users (Warriors and Officers)
Using passage data to measure the distance between their vessel and others in the area.
Challenge: Operating in high-pressure environments, they make quick decisions and need calculation and comparison capabilities.
Shore Users (maritime controler)
Using passage data to monitor and manage the entry of vessels into the port.
Challenge: Handling multiple vessels simultaneously, requiring comparison capabilities.
Primary Task Flow
Create passage data between multiple vessels.
Backgroud
“Zoharim” is a naval command system providing a complete maritime overview.
I designed the 'Passage Data' feature to enhance an existing tool, improving planning and vessel distance management based on user feedback.
The challenge
Current limitations prevent control operators from efficiently planning safe routes due to the lack of access to real-time ship transit data.
The concept
A feature that allows users to calculate and compare real-time transit data for multiple ships, enhancing route planning efficiency.
Background
“Zoharim” is a naval command system providing a complete maritime overview.
I designed the 'Passage Data' feature to enhance an existing tool, improving planning and vessel distance management based on user feedback.
The Challenge
Current limitations prevent control operators from efficiently planning safe routes due to the lack of access to real-time ship transit data.
The concept
A feature that allows users to calculate and compare real-time transit data for multiple ships, enhancing route planning efficiency.
Users research
To better understand the problem, I interviewed officers and control operators to learn how they use the system.
Some of the key questions I asked:
What is the purpose of the passage data form for you?
To ensure the safety of navigation and to be aware that I am not getting close to other vessels.
At what stage of the sailing do you use passage data?
Most of the time, especially when we enter ports and there are many vessels.
How many vessels are we talking about?
It depends, most of the time, I need to calculate passage data for 3 to 5 vessels simultaneously.
What is the purpose of the passage data form for you?
To ensure the safety of navigation and to be aware that I am not getting close to other vessels.
What is the purpose of the passage data form for you?
The minimum distance varies depending on instructions from the commander.
Sea Users (Warriors and Officers)
Using passage data to measure the distance between their vessel and others in the area.
Challenge: Operating in high-pressure environments, they make quick decisions and need calculation and comparison capabilities.
Shore Users (maritime controler)
Using passage data to monitor and manage the entry of vessels into the port.
Challenge: Handling multiple vessels simultaneously, requiring comparison capabilities.
Insights
Navigation Safety: Users rely on transition data to prevent collisions, emphasizing the need for accurate, real-time information.
Manage Multiple Vessels:Users mange data for 3-5 vessels, requiring a user-friendly interface that can manage multiple data points simultaneously.
Warning Zone: When there are many vessels, it’s hard to monitor minimum distances. Users need a tool to set and receive alerts for minimum safe distances.
sailing Planning: Users plan sailing routes in advance and need a tool that integrates planning with real-time data to adjust speed and course.
Manage Multiple Vessels
The user research highlighted the need to manage data for multiple vessels.
What started as a task for a calculator feature expanded into creating a comparative table to handle information overload effectively.
Before
Users had to create new cards for each vessel to calculate distances.
There was no clear indication if the transition data was safe for navigation.

After
A table was added to compare vessel transition ranges, with sorting options by distance and time.
A minimum range feature was added, including notifications when the range is reached.
Passage Data calculator
I improved real-time vessel adjustments by designing a more accessible and user-friendly calculator. The old tool lacked live data integration and was hard to use. My solution seamlessly integrates into the system, allowing for dynamic updates and better decision-making during operations.
Live map updates show how vessels will pass each other based on simulated data.
Helps operators evaluate and adjust navigation for safer operations.
Compares multiple vessels in one view for better situational understanding.
Allows fast data adjustments using +/- keys, enabling quick jumps between values without manual input each time.
Usability Testing
I conducted usability tests with the users and introduced them to a prototype. During the real-time simulation with the calculator, I noticed that they struggled and were confused about what the data on the map represented.
As a result, I changed the source vessel's course color to white (to clarify that the speed is not real) and added a snackbar on the map explaining that the current data is simulated.
81.0
52.3
13.4
15.7
97°/14,500 NM
14°/10,700 NM
14°/12,500 NM
15:20:56
ETA 14:12
15:20:56
ETA 14:12
15:20:56
ETA 14:12
Before
There was no clear indication if the data was real-time or a simulated calculation.
81.0
52.3
13.4
15.7
97°/14,500 NM
14°/10,700 NM
14°/12,500 YD
15:20:56
ETA 14:12
15:20:56
ETA 14:12
15:20:56
ETA 14:12
Displayed data are based on calculator inputs
After
A different color and a snackbar now indicate that the data is simulated.
Ships Passing Data
“Zoharim” feature
The Challenge
Current limitations prevent control operators from efficiently planning safe routes due to the lack of access to real-time ship transit data.
Background
“Zoharim” is a naval command system providing a complete maritime overview.
I designed the 'Passage Data' feature to enhance an existing tool, improving planning and vessel distance management based on user feedback.
Insights
Navigation Safety: Users rely on transition data to prevent collisions, emphasizing the need for accurate, real-time information.
Manage Multiple Vessels:Users mange data for 3-5 vessels, requiring a user-friendly interface that can manage multiple data points simultaneously.
Warning Zone: When there are many vessels, it’s hard to monitor minimum distances. Users need a tool to set and receive alerts for minimum safe distances.
sailing Planning: Users plan sailing routes in advance and need a tool that integrates planning with real-time data to adjust speed and course.
personas
Based on the user research, I identified two main personas:
Sea Users (Warriors and Officers)
Using passage data to measure the distance between their vessel and others in the area.
Challenge: Operating in high-pressure environments, they make quick decisions and need calculation and comparison capabilities.
Shore Users (maritime controler)
Using passage data to monitor and manage the entry of vessels into the port.
Challenge: Handling multiple vessels simultaneously, requiring comparison capabilities.
Passage Data calculator
I improved real-time vessel adjustments by designing a more accessible and user-friendly calculator. The old tool lacked live data integration and was hard to use. My solution seamlessly integrates into the system, allowing for dynamic updates and better decision-making during operations.
Usability Testing
I conducted usability tests with the users and introduced them to a prototype. During the real-time simulation with the calculator, I noticed that they struggled and were confused about what the data on the map represented.
As a result, I changed the source vessel's course color to white (to clarify that the speed is not real) and added a snackbar on the map explaining that the current data is simulated.
Before
There was no clear indication if the data was real-time or a simulated calculation.

After
A different color and a snackbar now indicate that the data is simulated.
Ships Passing Data
“Zoharim” feature
The concept
A feature that allows users to calculate and compare real-time transit data for multiple ships, enhancing route planning efficiency.
Users research
To better understand the problem, I interviewed officers and control operators to learn how they use the system.
Some of the key questions I asked:
Live map updates show how vessels will pass each other based on simulated data.
Helps operators evaluate and adjust navigation for safer operations.
Compares multiple vessels in one view for better situational understanding.
Allows fast data adjustments using +/- keys, enabling quick jumps between values without manual input each time.
What is the purpose of the passage data form for you?
To ensure the safety of navigation and to be aware that I am not getting close to other vessels.
At what stage of the sailing do you use passage data?
Most of the time, especially when we enter ports and there are many vessels.
How many vessels are we talking about?
It depends, most of the time, I need to calculate passage data for 3 to 5 vessels simultaneously.
What is the purpose of the passage data form for you?
To ensure the safety of navigation and to be aware that I am not getting close to other vessels.
What is the purpose of the passage data form for you?
The minimum distance varies depending on instructions from the commander.
Manage Multiple Vessels
The user research highlighted the need to manage data for multiple vessels.
What started as a task for a calculator feature expanded into creating a comparative table to handle information overload effectively.
Before
Users had to create new cards for each vessel to calculate distances.
There was no clear indication if the transition data was safe for navigation.
After
A table was added to compare vessel transition ranges, with sorting options by distance and time.
A minimum range feature was added, including notifications when the range is reached.
Ship sites with style.
Go from design to site with Framer, the web builder for creative pros.
Go from design to site with Framer, the web builder for creative pros.
Get Started
Learn More